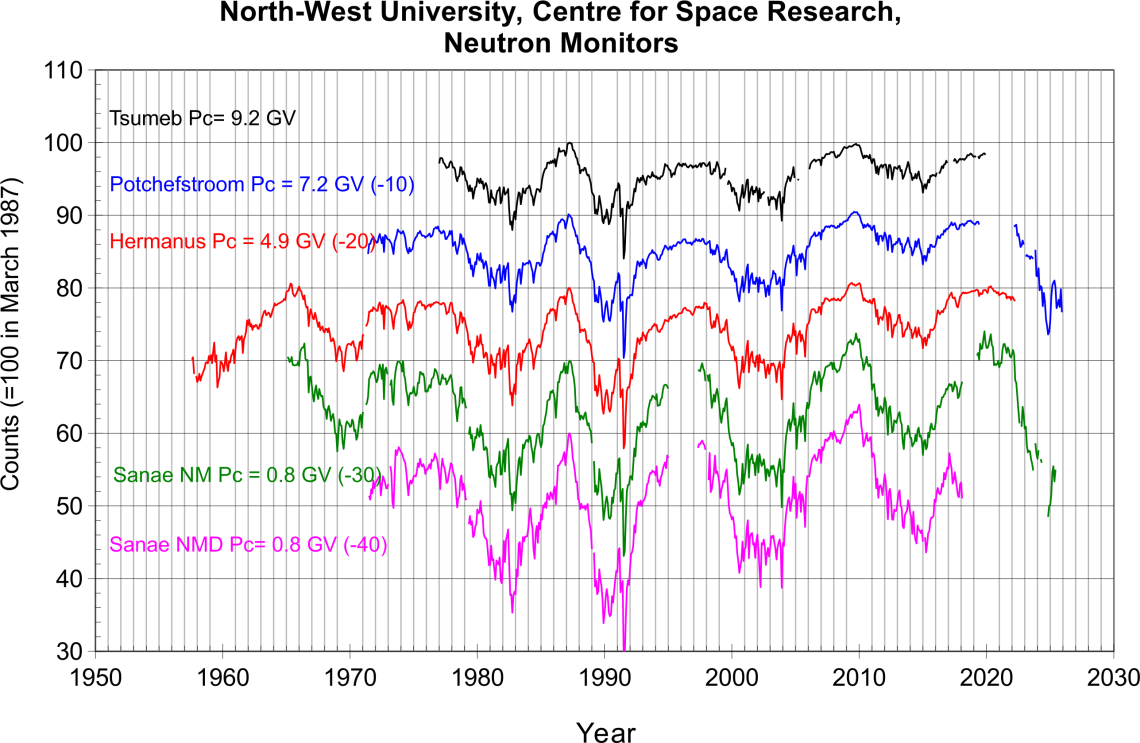
Graphs & data of long term monthly averages normalized to 100 for March 1987

• SRU Neutron Monitor monthly averages * [31KB]
Data normalized to 100 for March 1987. This file contains the latest corrections for long-term stability and it is recommended that this one should be used for long-term studies. Other variants of the data files do not yet contain this latest correction. This latest correction is for SANAE and SANAE NMD, increased by +2% since April 1997, and it will be explained in a paper at the 32nd ICRC in 2011
• SRU Neutron Monitors Monthly Graphs * [28KB pdf]
This graph is drawn from the above data
 |
Neutron Monitor Tsumeb : 1976_339 to 2020_130 [10.1 MB] | |
 |
Neutron Monitor at Potchefstroom : 1971_121 to 2021_120 [10.6 MB] 2022_032 to 2025_334 [1. MB] | |
 |
Neutron Monitor Hermanus : 1957_149 to 2022_090 [14.6 MB] | |
 |
Neutron Moderated Detector at SANAE : NMD 1971_122 to 2018_31 [10.1 MB] | |
 |
Neutron Monitor at SANAE : NM64 1964_233 to 2018_031 [11.6 MB] 2019_052 to 2025_334 [1.8 MB] |
